Analysing Graphs & Charts LET’S DEFEND
Description
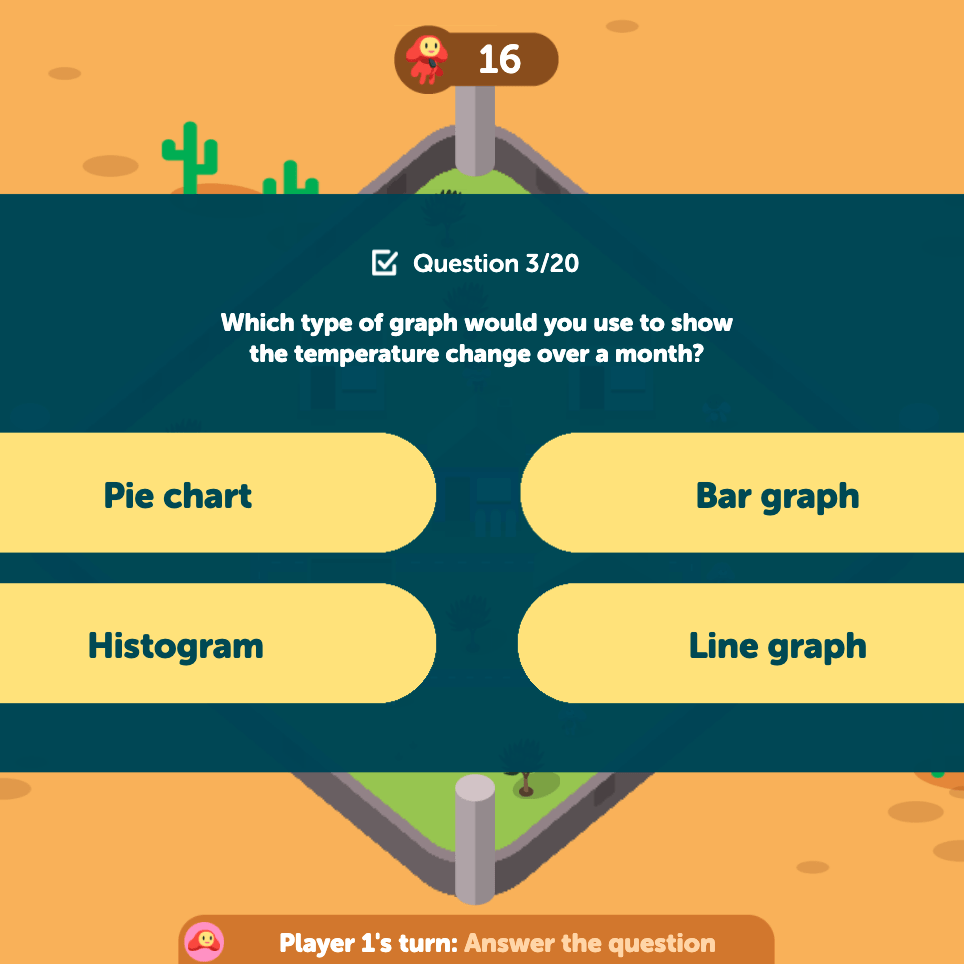
Giant robots are attacking the town, and the only way to save it is with data-driven decisions! In this action-packed defence game, students must protect their growing town by accurately identifying the best graphs to represent different sets of data. Each successful defence strengthens their understanding of how data can be visualised and used to make strategic choices.
Players are presented with a series of short real-world scenarios or data sets and must determine which type of graph – column, bar, line, picture, or other – would be the most appropriate representation. As students make correct selections, they earn resources to build homes, grow the population, and boost the town’s defences. Incorrect answers leave the town vulnerable to the relentless robot invasion, adding a thrilling urgency to each decision.
Let’s Defend – Analysing Graphs & Charts is designed to support students in Years 3–4 as they develop critical thinking and data literacy aligned to the Statistics strand. The game format encourages learners to think deeply about how data is represented and why certain graphs are more effective for particular types of information.
Key Learning Outcomes:
- ✅ Identify different types of graphs and charts (e.g. bar, column, line, picture)
- ✅ Match appropriate graph types to different data sets or situations
- ✅ Develop skills in interpreting and selecting data displays
- ✅ Use data reasoning to support decision-making in a strategic context
How to Play:
- Students begin with a basic town under attack by giant robots.
- They are presented with a data set or real-life scenario.
- Students choose which graph best represents the data provided.
- Correct answers earn them the choice to defend, grow, or upgrade the town.
- If too many answers are incorrect, the town risks collapse under attack!
Ideas for Classroom Use:
- 💡 Introduce at the start of a unit on data and graphing to spark engagement.
- 💡 Use in small groups during maths rotations for collaborative reasoning tasks.
- 💡 Reinforce key graphing concepts through whole-class play on the IWB.
- 💡 Offer as a fast finisher or early revision tool before an assessment on data representation.
Top Teacher Tips:
- 💛 Scaffold with an anchor chart displaying graph types and their common uses.
- 💛 Pause the game after challenging questions to facilitate peer discussion.
- 💛 Use student answers as the basis for follow-up graphing activities post-gameplay.
Let’s Defend – Analysing Graphs & Charts gives data representation a high-stakes mission – can your students hold the line with the power of graphing skills?
Additional information
| Australian Curriculum Code | AC9M3ST02, AC9M4ST02 |
|---|
Australian Curriculum V9
F - 6
Lorem ipsum dolor sit amet, consectetur adipiscing elit.
Lorem ipsum dolor sit amet, consectetur adipiscing elit.
Lorem ipsum/ Lorem ipsum/ Lorem ipsum
Lorem ipsum dolor sit amet, consectetur adipiscing elit.
Lorem ipsum dolor sit amet, consectetur adipiscing elit.
Lorem ipsum/ Lorem ipsum/ Lorem ipsum
Lorem ipsum dolor sit amet, consectetur adipiscing elit.
Lorem ipsum dolor sit amet, consectetur adipiscing elit.
Lorem ipsum/ Lorem ipsum/ Lorem ipsum
Lorem ipsum dolor sit amet, consectetur adipiscing elit.
Lorem ipsum dolor sit amet, consectetur adipiscing elit.
Lorem ipsum/ Lorem ipsum/ Lorem ipsum
Lorem ipsum dolor sit amet, consectetur adipiscing elit.
Lorem ipsum dolor sit amet, consectetur adipiscing elit.
Lorem ipsum/ Lorem ipsum/ Lorem ipsum


